

In our two previous articles, Daily River Rhythms and Peaks and Troughs, we explored what we can learn from the data provided by an Aquawatch WaQA continuous water-quality monitoring system installed by the Ōpāwaho Heathcote River Network in the Waimōkihi, just upstream of its confluence with the main stem of the Ōpāwaho Heathcote River. In this article, we continue our exploration of that data looking at what changes in pH reveal, including possible illicit activity.
Recording key water-quality indicators every 15 minutes, the Aquawatch WaQA system reveals a distinct daily rhythm in the river, closely linked to sunlight, temperature and rainfall.
pH – the daily swing between acid and alkali The pH scale tells us whether water is acidic or alkaline. A pH of 7 is neutral, while values below 7 are acidic and values above 7 are alkaline. Although pH and dissolved oxygen are not directly connected chemically, they often rise and fall together because both are influenced by biological activity and carbon dioxide levels.
During daylight, aquatic plants and algae use sunlight to convert carbon dioxide and water into food through photosynthesis. In doing so, they produce oxygen and reduce carbon dioxide in the water, causing pH to rise.
At night, photosynthesis stops. Plants, algae and microorganisms continue to respire, however, consuming oxygen and releasing carbon dioxide. When carbon dioxide dissolves in water it forms carbonic acid, causing pH to fall. The recommended guideline range for pH in Canterbury spring-fed plains urban surface waters is 6.5 – 8.5 and the water in the Waimōkihi achieves this even at the extreme of its daily range.
A sudden change in pH What are the possible reasons for a sudden shift in pH in a river like the Waimōkihi? A sudden shift in pH in an urban, spring-fed New Zealand stream usually happens because of:
- stormwater runoff following a rain event, or
- biological activity (rare – pretty extreme to be sudden), or
- discharges into the river by humans
A sudden fall in the pH, which makes the water slightly more acidic, might be caused by:
- First-flush stormwater runoff Rainwater is naturally slightly acidic. During heavy rain, runoff from roofs, roads, and asphalt bypasses soil buffering and floods the stream, and dropping the pH.
- Wastewater overflows or sewage leaks Broken sewer pipes, faulty cross-connections, or wet-weather wastewater overflows introduce organic waste into the stream. As bacteria rapidly break down this organic matter, they release carbon dioxide and organic acids.
- Industrial or trade spills Accidental or deliberate discharges of acidic cleaners, pool chemicals, battery acid, or trade waste into street sumps and thence into the stream can cause immediate, localized acid shock.
A sudden rise in the pH which makes the water slightly more alkaline might be caused by:
- Concrete and construction wash-water Wet cement, concrete cutting slurry, and dust from urban building sites contain high levels of lime. If washed into a stormwater drain and then into the river, this creates a strongly alkaline plume that can rapidly spike pH.
- Household and commercial detergents Illegal dumping or runoff from car washing, driveway cleaning, and commercial wash-downs introduces alkaline soaps, bleach, and degreasers straight into the stormwater network and thence into the river.
- Concrete stormwater infrastructure After a long dry spell, the first flush of rainwater passing through concrete pipes and culverts dissolves calcium and bicarbonate, raising the pH of the runoff entering the stream
Other indicators Changes in pH are often accompanied by changes in other water-quality indicators. Fortunately, the WaQA also records dissolved oxygen (DO) and electrical conductivity (EC), providing additional information that can help distinguish between possible causes.
The following table summarises the expected responses under different conditions:
| Mechanism | pH | Dissolved Oxygen (DO) | Electrical Conductivity (EC) |
| Concrete / Lime Wash | Rises | Minimal / No change | Rises |
| Inorganic Chemical Spill | Rises or Falls | Minimal / No change | Rises |
| First-Flush Rain Runoff | Falls | Slight rise (aeration) | Falls (dilution) |
| Sewage / Organic Leak | Falls | Falls | Rises |
These relationships are indicative rather than definitive, but comparing several parameters provides a much more useful picture than interpreting a change in pH alone.
A blip on the graph On 28 September 2026, at approximately 9.45 pm, the WaQA recorded a sharp rise in pH in the Waimōkihi. The elevated reading continued until around 10.15 pm, before rapidly returning to its normal level. On its own, this would have been an interesting but unexplained occurrence.
However, almost exactly the same pattern appeared the following night, and again on each of the succeeding nights.
The timing was remarkably consistent, although not identical. The abnormal readings began between 8.00 pm and 10.00 pm and, given the system’s 15-minute sampling interval, appeared to last no more than 30 minutes.
The recorded pH change averaged approximately 0.15 units. While relatively small in absolute terms, this was a noticeable deviation from the normal pattern of evening pH fluctuations, particularly given the relatively rapid flow of water through the monitoring site.
What could explain such a regular, short-lived change?
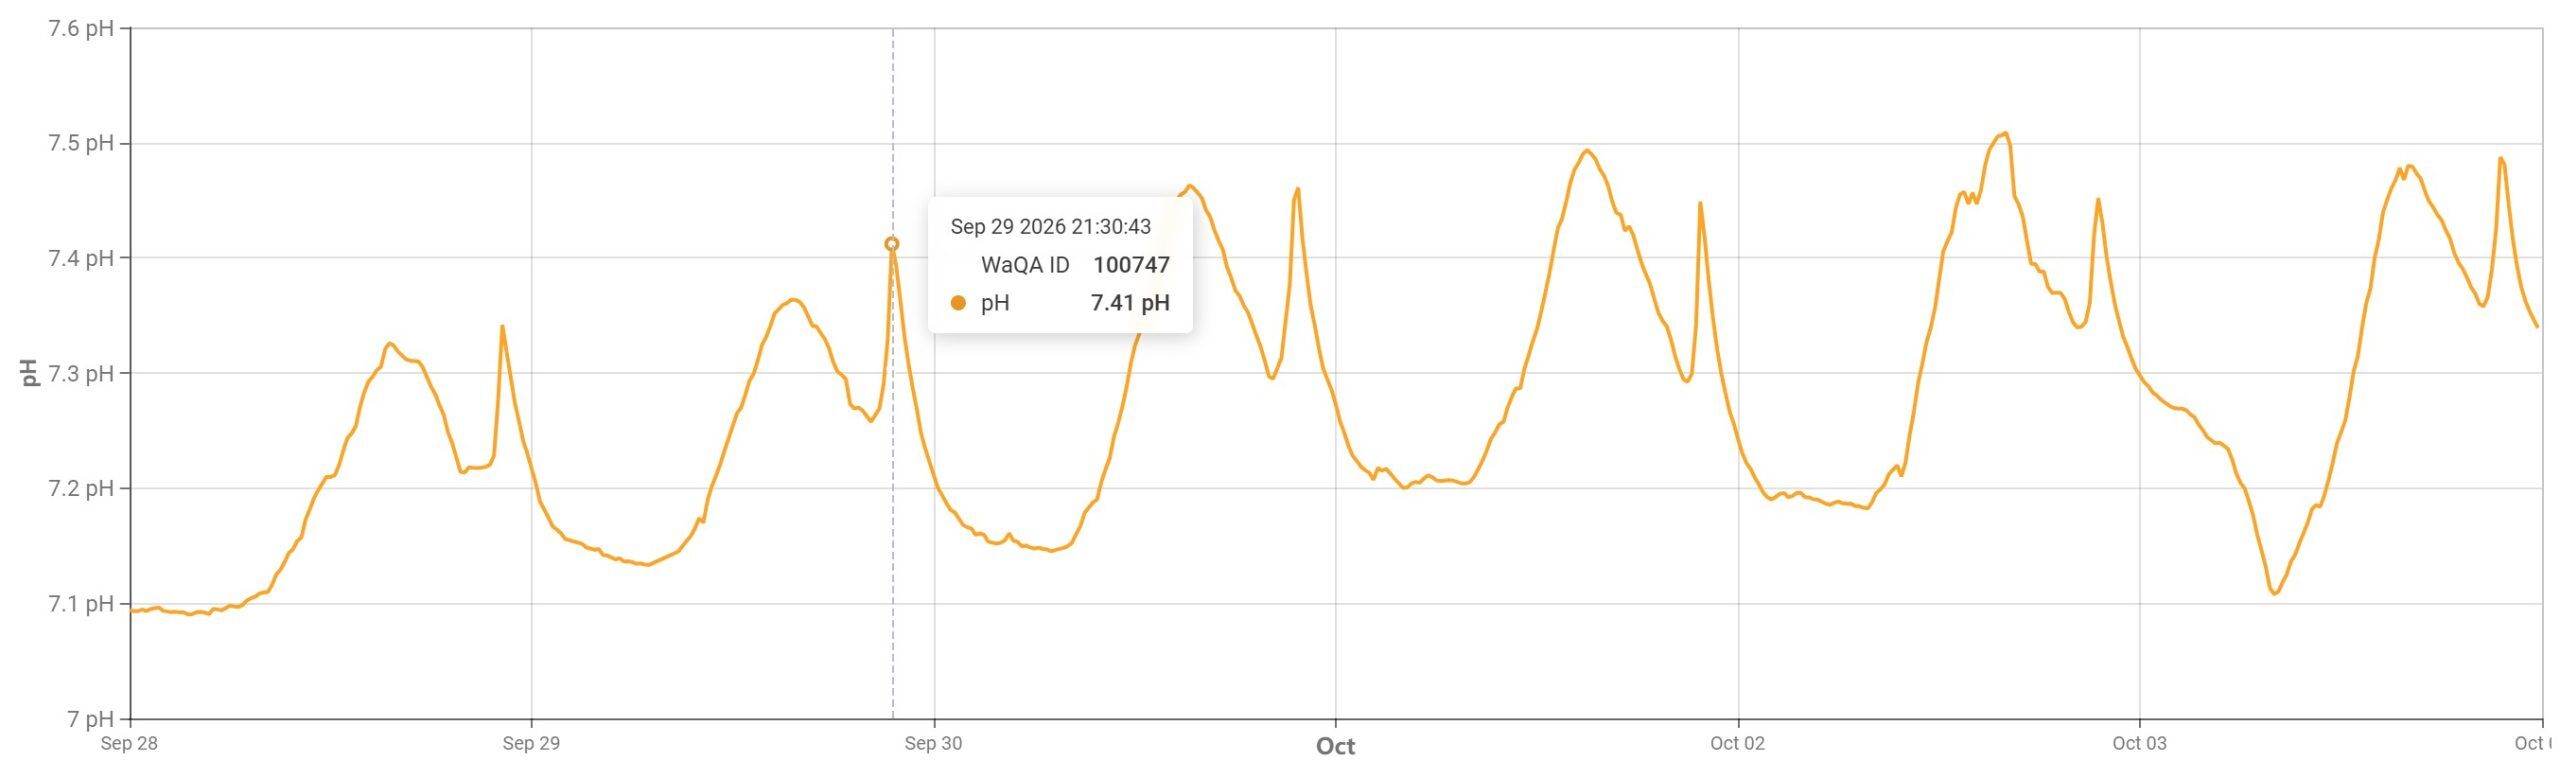
The first few days of the pH abnormality. [Click to enlarge]
None of these activities should affect river water quality, as wastewater is supposed to be discharged into the sewer network, not the stormwater system. However, an incorrectly connected appliance, or an unauthorised discharge from a property close to the river, could potentially introduce wastewater directly into the stormwater network.
The possibility of a visiting motorhome also came under consideration. A vehicle parked nearby could, for example, have been discharging greywater into a stormwater drain before eventually moving on. This theory appeared plausible when the recurring pH anomaly stopped on 28 October.
However, closer examination of the monitoring data revealed an important detail: none of the pH spikes was accompanied by a corresponding change in dissolved oxygen or electrical conductivity. A discharge of chemicals or wastewater into the river would normally be expected to affect at least one of these other indicators. This made an external discharge increasingly unlikely.
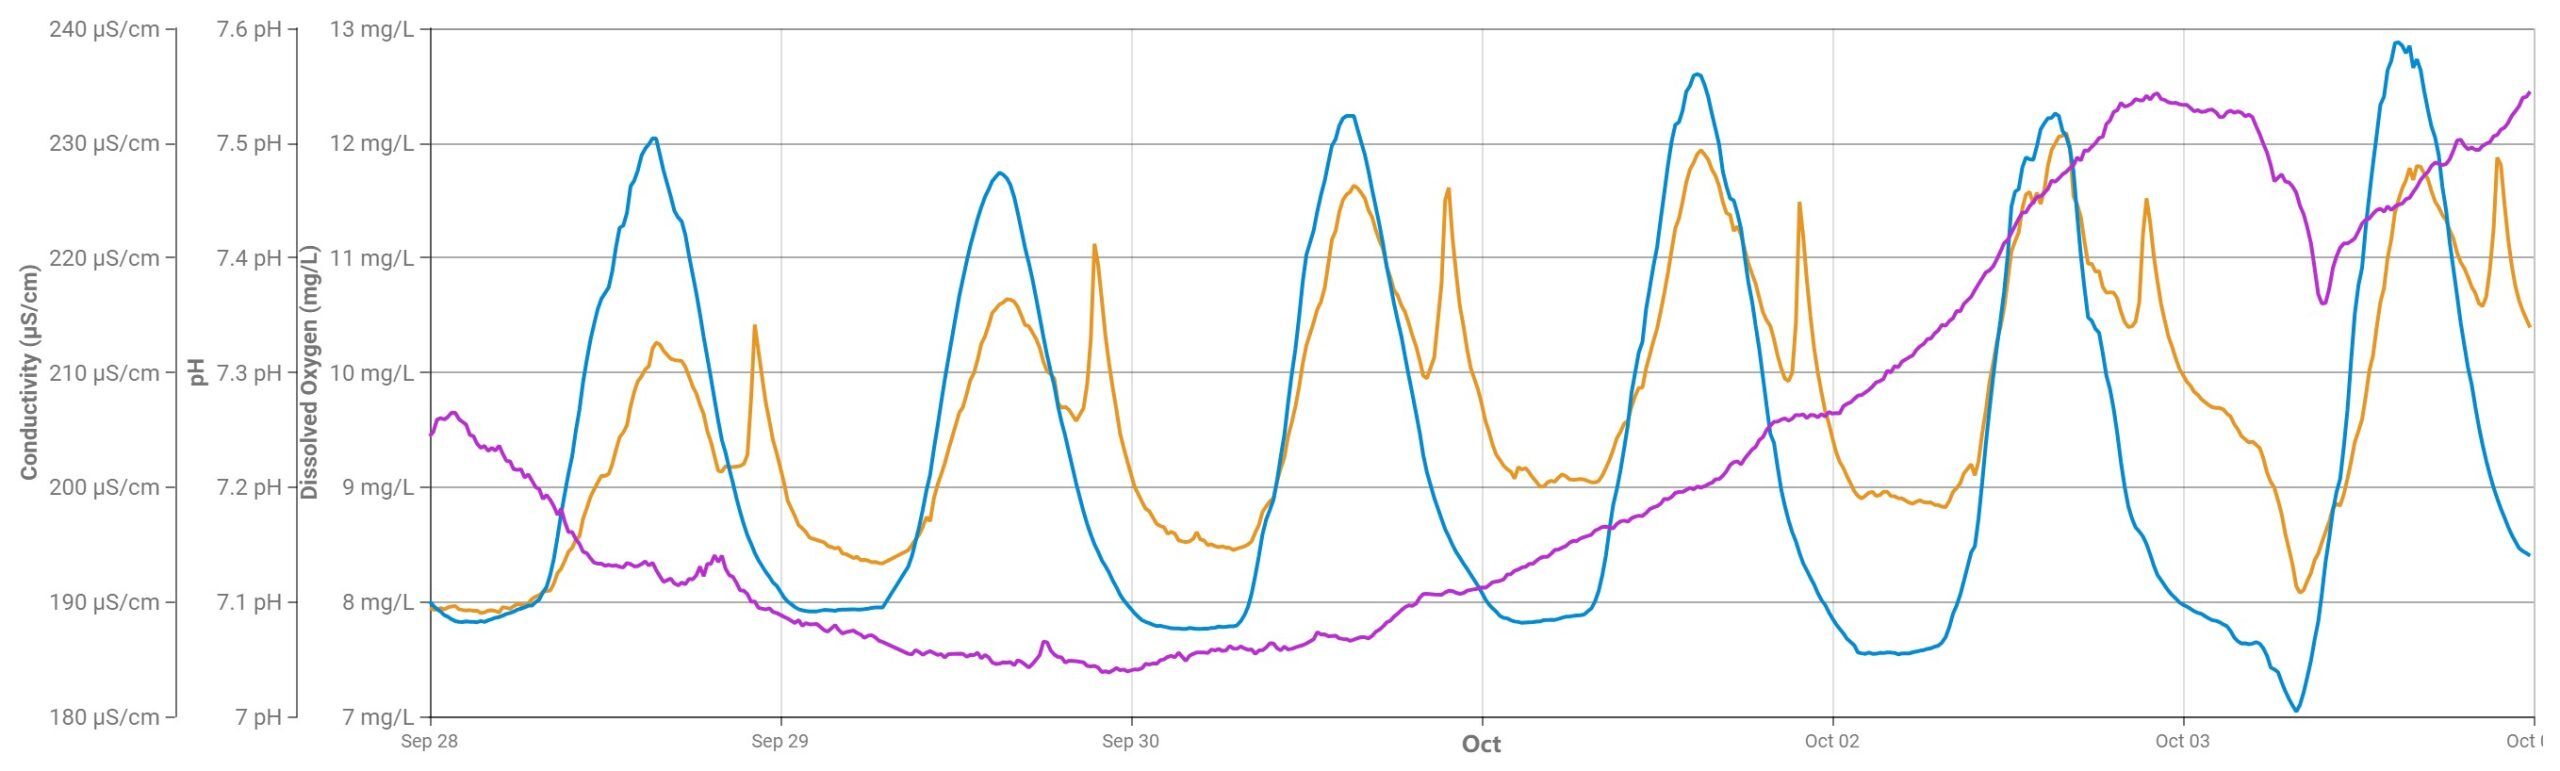
The same days showing all three parameters – pH (yellow;) electrical conductivity (purple); dissolved oxygen (blue)
The unexpected explanation After considering all the evidence, we concluded that the most likely explanation was not a change in the river itself, but a localised interaction with the pH probe.
One possibility is that a tiny gas bubble became attached to the probe’s glass pH-sensitive membrane or reference junction. Such contact can interfere with the electrode’s response and produce an abrupt change in the recorded reading. As water flows past the probe, the bubble may eventually dissolve or become dislodged, allowing the reading to return to normal.
But why would this happen repeatedly at roughly the same time each evening?
The monitoring unit was positioned above a patch of macrophyte weed. Aquatic plants release gases, and it is possible that bubbles were being dislodged from the vegetation as part of its daily biological cycle. Whether this was responsible for the recurring anomaly remains uncertain.
We have since removed the weed. The WaQA continues to record the familiar daily fluctuations associated with sunlight and photosynthesis without the evening abnormality.
The episode illustrates an important aspect of continuous water-quality monitoring: unusual readings can indicate pollution events, not every indicated event is for real. The real value of the technology lies in its ability to identify unexpected changes, compare different water-quality indicators and provide the evidence needed to investigate what is happening in the river.
Our watch of water quality parameters continues, every 15 minutes.