
Every August, Christchurch City Council’s water team reports to the community on the quality of the city’s surface water and the work being undertaken to improve it. The reporting is a requirement of the Council’s comprehensive stormwater discharge consent.
We know a great deal about the water quality of the Ōpāwaho Heathcote River because Christchurch City Council undertakes regular monitoring as part of that consent. But what do the latest results actually tell us about the health of the river?<
The overall health of a waterway is assessed using three measures: the Water Quality Index (WQI), Sediment Quality Index (SQI) and Quantitative Macroinvertebrate Community Index (QMCI). The SQI and QMCI are based on surveys undertaken on a five-year rotation, while the WQI is calculated annually from monthly water samples.
For the Ōpāwaho Heathcote River, the headline result is encouraging. Every year since 2017, the river has received an overall assessment of “D – Poor”. In 2025, however, that assessment improved to “C – Fair”.
That is certainly worth celebrating. But before we get too excited, it is important to understand what sits behind the result.
The CCC Ecology team rightly and fairly indicate that the “C – Fair” assessment reflects stronger compliance and improvements in overall water-quality and macroinvertebrate measures. Sediment quality remains the weakest component, with a number of sites exceeding guidance levels.
For many residents, the improvement may seem at odds with what they see after heavy rain, when the river can turn noticeably brown with sediment. Extended periods of elevated flows occur as stormwater retention ponds in the upper catchment empty into the river.
What is being measured? The Comprehensive Stormwater Network Discharge Consent requires monthly monitoring to assess compliance, long-term trends and overall waterway health. A “grab” sample is taken once a month at each of 14 monitoring sites along the Ōpāwaho Heathcote River. Each sample is tested for 11 measures, including:
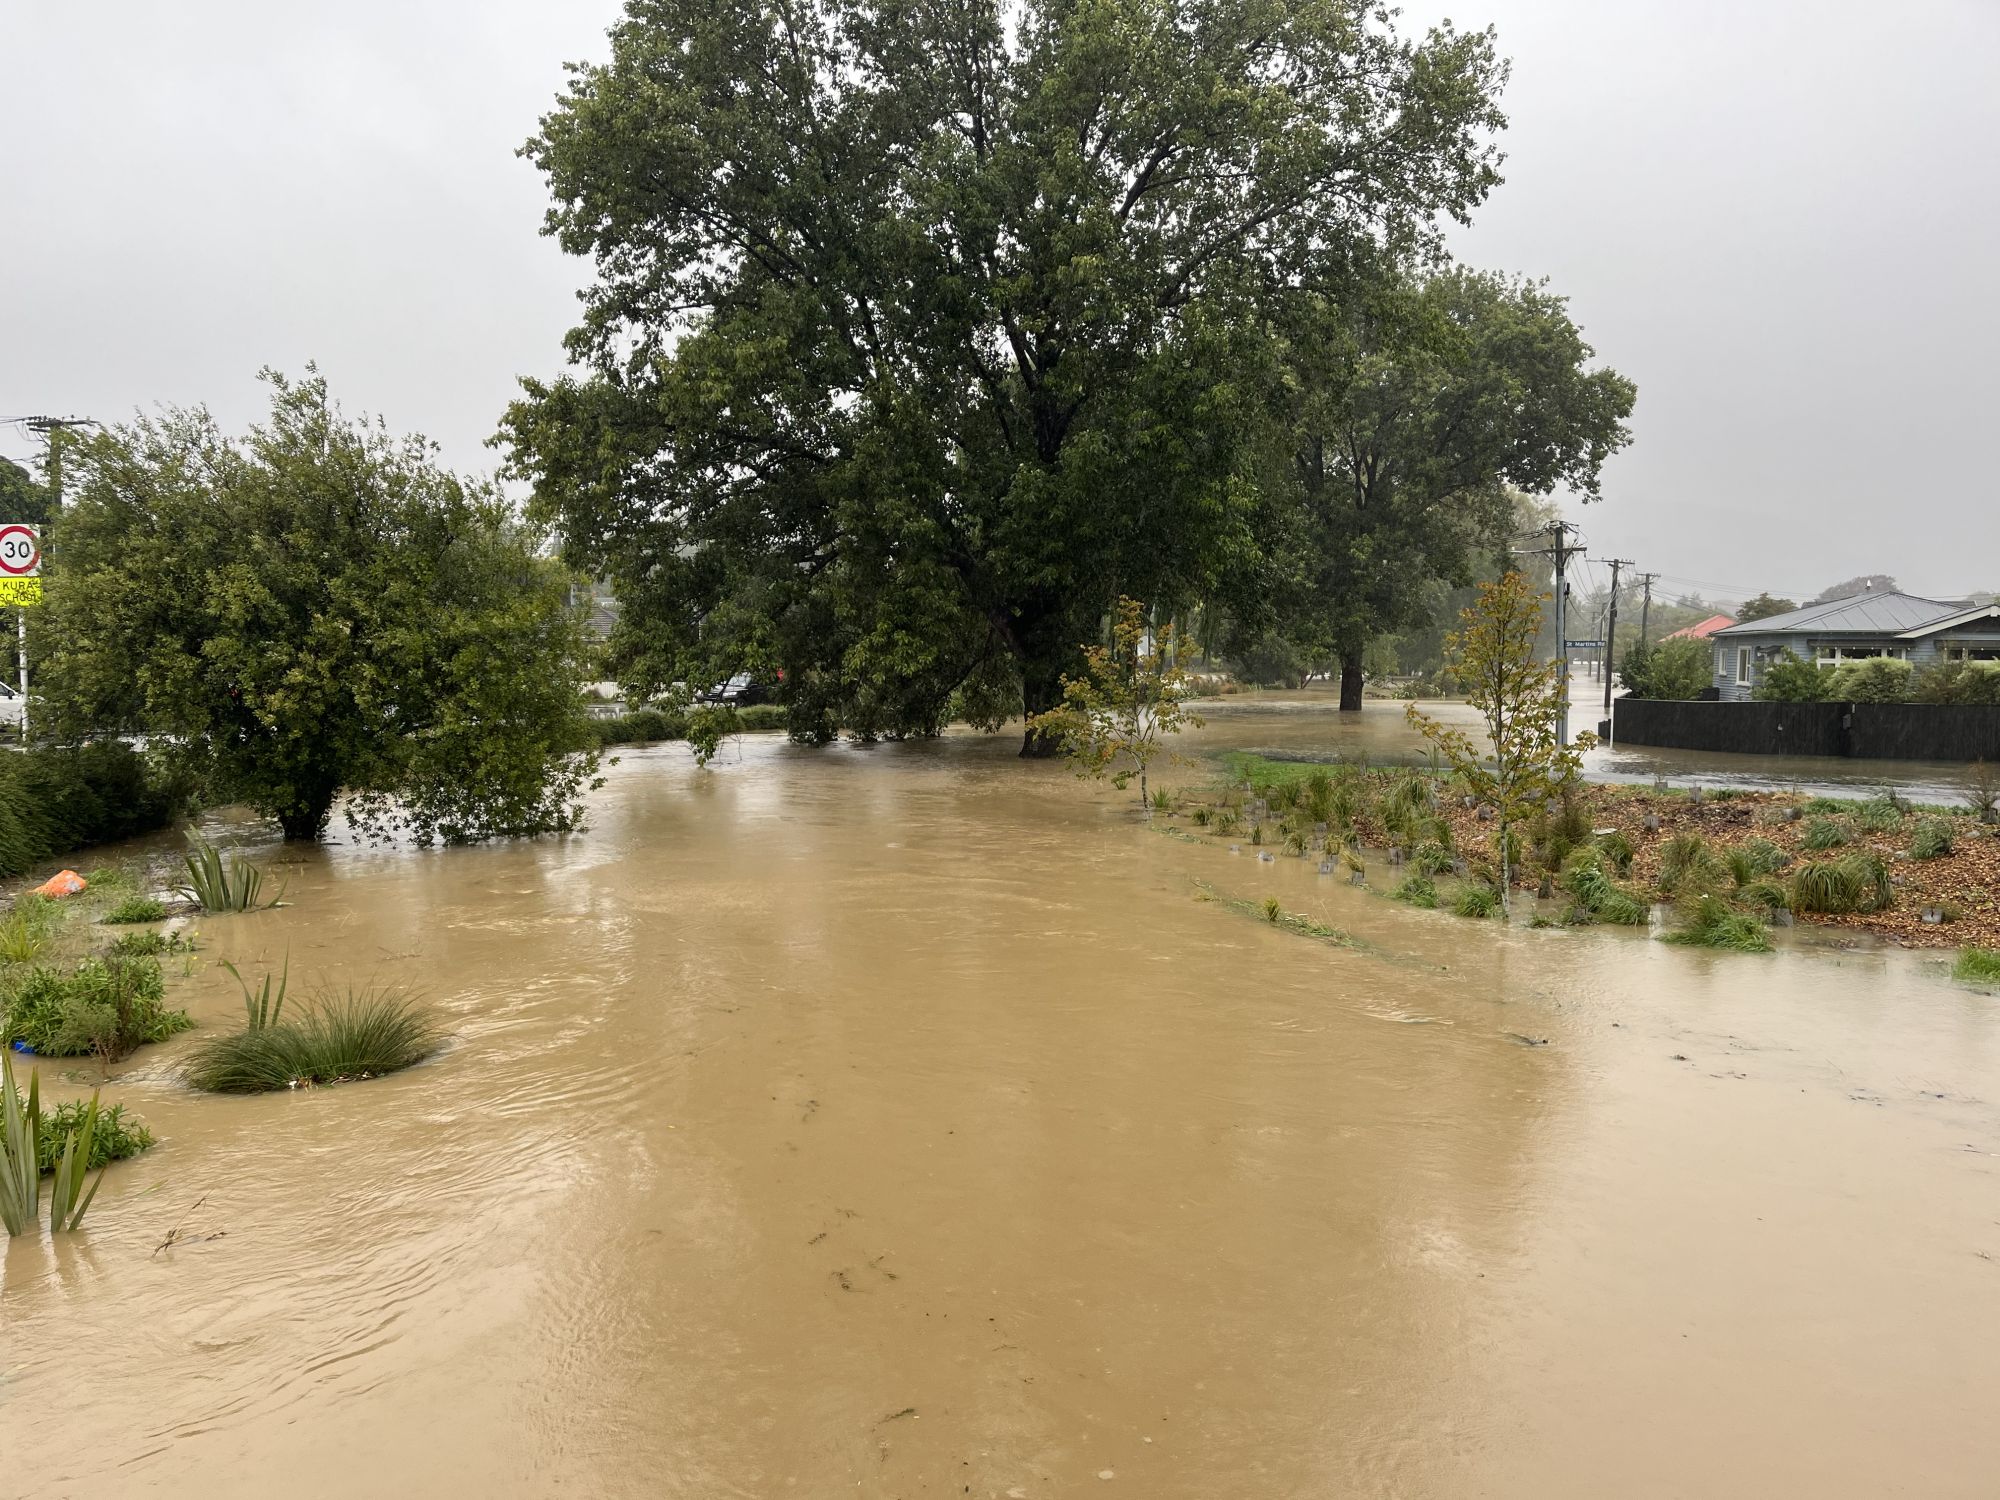
Rain events such as the one in February or July can, by chance, miss being recorded by monthly water testing.
- dissolved copper
- dissolved zinc
- pH
- total suspended solids (TSS)
- dissolved oxygen (DO)
- temperature
- biochemical oxygen demand (BOD5)
- total ammonia
- nitrate
- dissolved reactive phosphorus (DRP)
- E. coli.
That produces 154 individual measurements every month — or 1,848 data points each year for the Ōpāwaho Heathcote River alone. The same monitoring regime is undertaken across Christchurch’s other major waterways.<
To make sense of this information, the Council developed its Water Quality Index. The WQI considers three factors: the scope of contamination, meaning how many parameters exceed guideline values; the frequency of those exceedances; and their amplitude, or how far the guideline is exceeded.
Scores range from 0 to 100, with higher scores indicating better water quality:
- Very poor: 0–39.99
- Poor: 40–69.99
- Fair: 70–79.99
- Good: 80–89.99
- Very good: 90–100.
Because WQI scores have been calculated since 2016, they also provide an indication of the trend of changes over time.
| Sampling Site | WQI Score | Water Quality Category | Trend Period (Years) | WQI Trend |
|---|---|---|---|---|
| Heathcote at Warren Crescent | 87 | Good | 6 | Very likely improving |
| Haytons Stream at Retention Basin | 64 | Poor | 10 | Very likely improving |
| Curletts Stream at Southern Motorway | 50 | Poor | 10 | Very likely degrading |
| Curletts Stream upstream Heathcote Confluence | 60 | Poor | 10 | Likely degrading |
| Heathcote at Rose Street | 71 | Fair | 10 | Indeterminate |
| Cashmere Stream at Sutherlands Road | 76 | Fair | 10 | Likely degrading |
| Cashmere Stream at Worsleys Road | 81 | Good | 10 | Indeterminate |
| Cashmere Stream at Penruddock Rise | 77 | Fair | 1 | – |
| Heathcote at Ferniehurst Street | 80 | Good | 10 | Likely improving |
| Heathcote at Bowenvale Ave | 81 | Good | 10 | Very likely improving |
| Heathcote at Opawa Road / Clarendon Tce | 76 | Fair | 10 | Indeterminate |
| Heathcote at Mackenzie Avenue Footbridge | 85 | Good | 10 | Very likely improving |
| Heathcote at Catherine Street | 76 | Fair | 10 | Likely improving |
| Steamwharf Stream upstream of Dyers Road | 84 | Good | 6 | Indeterminant |
Results in 2025 The results are mixed — but there are some genuinely encouraging signs.
Heathcote at Warren Crescent recorded a WQI of 87, placing it in the Good category, with a trend described as very likely improving. Six of the 14 monitoring sites were assessed as either “likely improving” or “very likely improving”.
There are, however, significant areas of concern. Haytons Stream at the Retention Basin scored 64, while Curletts Stream at the Southern Motorway scored 50. Both were classified as Poor. Curletts Stream upstream of the Heathcote confluence also scored poorly and was assessed as likely degrading.
These results are not entirely unexpected. Haytons and Curletts Streams drain the Hornby industrial area and motorway corridor, both significant potential sources of stormwater contaminants. The Council’s Industrial Stormwater Consents team works with businesses in these areas to improve the quality of stormwater leaving their properties.
The Council’s Stormwater and Land Drainage Bylaw 2022 also requires businesses meeting specified criteria to register with the Council. Registered businesses can be audited and required to improve their stormwater management. As the bylaw only came into effect in 2023, it will take time for the cumulative effect of these measures to become evident in water-quality data.
At the other end of the scale, almost half of the monitoring sites were rated Good. Many of these sites are at, or downstream from, significant spring inflows, which can dilute contaminants entering the river from further upstream.
Encouraging signs — and reasons to remain cautious The 2025 results contain some particularly positive findings.
Lead: All sampling sites recorded dissolved lead below the relevant guidance level, with trends assessed as likely improving. It is important to note that this relates to dissolved lead in the water column, rather than lead contained in sediment.
Copper: Most sites met the guidance level for dissolved copper. Only Curletts Stream at the motorway and Cashmere Stream at Sutherlands Road failed to do so. The reduction of copper in vehicle brake pads may be contributing to this improvement.
Zinc: The picture is more complicated. Zinc enters urban waterways from sources including roofs, plated metal surfaces and vehicle tyres. Although some sites exceeded guidance levels, almost all showed a trend that was either likely or very likely improving. Changes to industrial runoff may be contributing, although reducing zinc contamination in a highly urbanised catchment remains challenging.
E. coli: Here the news is considerably less encouraging. E. coli can indicate contamination from human or animal waste, including sewage overflows and animal droppings. High levels are associated with poor water quality and unsafe conditions for swimming and other recreation.
The guideline for the Ōpāwaho Heathcote, classified as a spring-fed plains-urban waterway, is 550 E. coli per 100 millilitres for 95% of samples. In 2025, every monitoring site except Cashmere Stream at Sutherlands Road and Heathcote at Warren Crescent failed to meet that standard. Even those two sites offer little practical comfort for swimmers: water depths there are generally insufficient for swimming.
Looking beyond the monthly snapshot The 2025 results provide evidence that some aspects of the Ōpāwaho Heathcote River are improving. That is good news and deserves recognition. But the results also demonstrate why we need to look beyond annual averages and monthly snapshots.
A single sample taken once a month can, by chance, miss the significant changes that occur during and immediately after a rainfall event. Those are precisely the times when sediment and other contaminants can enter the river in greatest quantities.
That is why the Ōpāwaho Heathcote River Network is investigating the relationship between flow, turbidity and total suspended solids at the confluence of the Cashmere Valley Drain, Cashmere Stream and the Ōpāwaho Heathcote River using continuous water-quality monitoring.
The 2025 results give us reason for cautious optimism. Some measures are moving in the right direction, while others remain stubbornly poor. The challenge is to understand what is driving those changes — and to ensure that improvements measured on paper translate into a healthier river that Christchurch communities can see, experience and enjoy.